Using data to make important decisions just means being smart about your overall business strategy.
Yet, data is nothing without data analysis. And there is virtually no easier way to interpret data than data visualization.
So how do you get from having the data to actually driving your company’s progress forward with it?
This ultimate guide to data visualization is just what you’ve been looking for.
What Is a Data Visualization
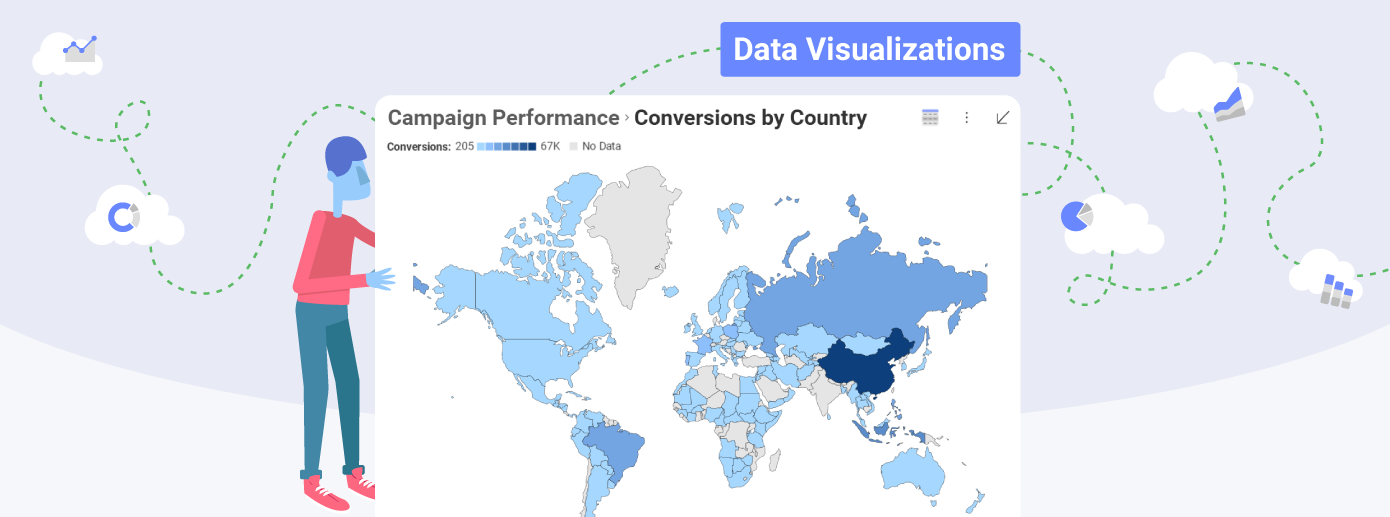
Data visualization is the visual translation of raw data into charts, maps, graphs, and other types of visuals. Through dashboards, data is visualized in a way that provides all the needed information at a glance and you can grab the insights on the go, allowing for quick and easy identification of what is happening and what needs to happen next.
Dashboards differ from infographics in that they present real-time information, taking data directly and showing it visually through different styles. They are the data analysts’ best friends in accessing insights quickly and on any type of device.
Besides data teams, marketers and managers also turn to those displays of data so that they discover and use patterns in their overall business strategy. Dashboards are also great generators of ideas: looking at the data of a project often helps to gain understanding and recognition of an issue that had previously remained hidden. In 2021, teams are more data-driven than ever and so looking at data in a smart way is a tactic that brings alignment, quality control, and efficiency in the decision-making process. Using data visualization is not limited to a data analytics team anymore: it’s something that can and should be close and available to anyone who wants to insert data into the core of their strategy and everyday approach to tasks.
Why Is Data Visualization Important: 3 Reasons
Having access to the right data is key for so many things in business – it opens the door to opportunities that you probably wouldn’t even check out otherwise. But just having access is not enough. The magic of data comes through bringing it to new levels through storytelling. Because data can tell you a story. And that happens through a structure that is easier to understand – a form where all the information you might need is highlighted, taken in at a glance, and quickly helping you see all patterns you need so you can explore your opportunities further.
But why is data visualization important? Let’s take a look at the three most important reasons.

Anyone Can Interact with Data
Data doesn’t have to be abstract – and yet, it somehow still is for people who tend to get lost in the sheer volumes of it. With data visualization, users can easily explore data, without needing to have special training first – our brains are inherently able to process the information easier through a graph, chart, or else. It gives a pricelessly quick overview to anyone who wants to interact and know data better – and use that knowledge.
Understand Every Correlation
Data is showing you the way – and with data visualization, you comprehend the essential connections you need to make between different occurrences in one glance. connections between business processes, results, and overall operations.
Aid in Decision-Making
Decisions should not be made on a hunch. Therefore, decision analysis is needed to make sure the information you have available at your hands is used in the best way possible. Good data visualizations take the data as it is and show it with no distortions leaving the interpretation to you – so the decision-making is kept always relevant and according to the factors you should be considering.
Data Visualization Benefits
If you are considering the use of data visualization in your organization’s everyday work, you are probably wondering what are the benefits you can outline for this. For your business purposes, this method will help you explore new ways to grow and improve both your team and your goals. Among the best benefits that data visualization can give your business are:

Adapt to Emerging Trends
Data visualization is the perfect tool for observing new opportunities and emerging trends that could not be spotted so easily otherwise. With data visualization techniques, market shifts can be spotted, consumers’ reactions and preferences – better understood, and even hardly noticeable trends can emerge, giving your business the option to adapt quickly and efficiently to them.
Enhanced Understanding of Operations
When you quickly understand and analyze important business metrics correctly, you already have an advantage on productivity. Data visualizations help businesses see all the meaningful correlations between the operations and the results. When you know why and when something occurs, the power is yours to change it and dig deeper into improvements and adaptations without getting stuck in a routine.
Save Valuable Time
Without data visualizations, a significant amount of time is spent sifting through large amounts of data, tagging the most important pieces, analyzing it, and creating detailed reports. Besides being time-consuming, this whole ordeal used to demand a trained person with an aptitude for data science, appropriate systems, and a way of thinking. With the right data visualization software, however, data visualizations are created in seconds, allowing for always having the most recent dashboards of up-to-date information.
Find Hidden Patterns
Traditional forms of representing data are often not so accurate in revealing patterns, hidden insights, and factors that lead to success. Utilizing data visualizations, however, leaves no stone unturned – and that goes for business insights, customer behavior, project performance, campaign management, and pinpointing which operations need improvement.
Detecting and Limiting Errors
Mistakes are part of all business operations, and a great learning opportunity – but only if you can spot them in time. Visualizing data means visualizing errors and quickly identifying areas for improvement, erroneous actions that lead to undesirable results, and this analysis is all you need to rally your team around the correct next step.
How Is Data Visualization Used
Basing your business progress on data as a source, companies can improve their services or products, personalize the experience for their audience and raise both their conversions and revenue. Visualizations play a great role in this. Through them, the potential for growth and development even in previously undeveloped areas for your business is easily fulfilled. Turning big data into a comprehensible source of insights has never been easier. But how is data visualization used and what for? Here’s an overview of the three most common usages.

Storytelling
Communicating stories is what data visualizations is all about. The best part? Any audience can understand it when it’s being shown clearly and concisely. Data visualizations help you identify the problem or the result at its core – so you can make swift decisions. Let data tell you a story that helps your organization thrive.
Examining Value and Risk
When you need to take so many factors in to really be able to analyze things accurately, data visualizations can be invaluable. Knowing what opportunities carry risk and what has true value gives you the benefit of always being one step ahead of potential problems.
Identifying Frequency
Data visualization is a great tool for determining how often important events for your project (or business) are happening and understand the logic behind it. For example, that could mean finding out how often your product is purchased in a specific area and where sales are lacking and effort should be increased.
Data Visualization Types
When we talk about data visualizations, most people immediately think of infographics. This is one of the most common types of data visualizations that are usually used to convey big loads of information quickly and efficiently. But what organizations are depending on more and more today as a tool, are dashboards – a customizable visualization that can be displayed in a variety of ways. So let’s take a look at some of the data visualization types you might want to use and their specific purposes.
Charts and Graphs
Through charts and graphs, which are one of the first types chosen for data visualizations, the overall story of data trends is told in a much faster way. They provide quick comparison and a better way for data analysis in the long term.

Box-and-whisker Plots
These are a great way to quickly see whether outliers are dragging a process up or down. They’re also valuable when comparing averages, standard deviations, and answering questions such as “Are these two processes statistically the same?”
Gauge Charts
This type of visualization provides an overview of the information as a reading on a dial. It can help you quickly discover how a certain project, campaign, or numbers are performing versus how they are expected to perform.
Histograms
This visualization shows the distribution of your data and helps in drawing probability conclusions. They can quickly demonstrate whether a process is hovering around the right mean or whether outliers are skewing results for data or outcomes.

Pie Charts
They illustrate what factors are at play in a process. Various versions of pie charts are good if you need to see whether each part of the whole is pulling its weight, or you want to see what factors are most important in a process or outcome.

Treemap Charts
These are data visualization tools that show hierarchical data using nested nodes (rectangles) of varying sizes and colors, making it easy to spot data patterns or to compare data quantities.

With dashboards, we have the advantage of built-in analysis tools that may help your team dive deeper into the metrics and never lose sight of what’s most important.
Interactive Data Visualization
Interactive data visualizations happen when the power of modern data analysis software meets the graphical representation. It occurs via a software application that captures the full extent of data by detailing it in a visual form.

Some recent studies show that 28% of businesses that use data visualization are more likely to find the relevant information for their business, compared to those who don’t. A successful data visualization is actionable and intuitive, presented in a manner that identifies goals and also issues, and allows your team to quickly act upon them.
With interactive data visualization, data is more engaging and easily adjusted. Other benefits include:
- Better use of analytics
- Increased creativity in design
- Valuable insights
- Context in complex data sets
- Spot trends ahead of competitors
- Ability to change strategy on the go
- Identifying a cause of a problem
Data Visualization with Python
Data visualizations written in languages Python help identify trends, patterns, and correlations that you might have otherwise never discovered. Python is a general-purpose programming language that includes high-level data structures, dynamic typic and dynamic binding, and a variety of other features that make it a good choice for the development of complex applications. Python is presenting developers with a myriad of options to visualize data and gain insights that raw data alone cannot provide them with.
Using Python to create your data visualizations will assist with:
- Helping your users gain data insights in milliseconds compared to seconds or even minutes trying to analyze and understand large data sets of unformatted data
- Letting you add color, trend lines, markers, annotations, and many more visual cues to instantly understand the story of the data
- Supports interactive data visualization – Bokeh is an interactive visualization library that renders its graphics using HTML and JavaScript. However, Bokeh provides a Python API to create interactive visualizations in D3.js with or without the necessity of writing any JavaScript code.

As businesses continue to rely on data to make better and fact-based decisions, the importance of data visualization will grow even more. And since visualization techniques like charts and graphs are more efficient in terms of understanding data in comparison to traditional spreadsheets and outdated data reports, using tools like Python to create data visualizations is a necessity for every cross-functional team. To dive more deeply into the topic, check out our article on data visualization with Python.
Data Visualization in R
Using R as a data analytics language lets developers and data scientists create various types of visualizations to represent complex, raw data with minimum coding. By using R’s diverse functionalities, you can create appealing data visualizations by writing only a few lines of code. To create data visualizations, R provides several visualization libraries including ggplot2 which is one of the most widely used packages.
If we want to compare R to Python, we can point out a few differences – like the fact that R is a language that is primarily used for data analysis, while Python is a general-purpose programming language that can also be used for data analysis, but this isn’t its primary purpose.
Both are well-equipped for data visualization but customizing graphics in R is generally easier and more intuitive. R was built to demonstrate the results of statistical analysis with the base graphics module allowing you to create charts and plots with ease, and you can also use ggplot2 for more advanced pilots.
To read more on why R could be the answer for your data visualizations, go to our article on Data Visualization in R.
Data visualization: Best Practices
As we’ve already said, data visualizations are all about making large loads of numbers and statics digestible and easy to understand, by combining them all in one good visual. So, what are the best data visualization practices you should follow? Here are the five most important ones.
Address the Right Audience
Design your visualization according to a specific target audience, taking into account their challenges, desires, and potential roadblocks. Determining the right audience will help you design the perfect dashboard and empower them with knowledge.
Choose the Right Visual
To show the beauty and usefulness of data, you need to choose the right visual chart. This chart is your data’s visual voice – make sure it responds to your purpose and shows the story you want to tell most efficiently.
Clean the Data
Before presenting data visually, you need to clean the dataset so that is can be easily consumed by your data visualization software.
Select the Right Data Visualization Tool
To save time and create dashboards to make your data proud, choosing the right data visualization tool/software is vital – so you can create a variety of visualizations for your data with a few clicks, in seconds, and share them freely.
How to Choose Your Data Visualization Software: Try Slingshot
In choosing your data visualization software, you need to make sure it’s able to connect to all the data you have in different systems and build a dashboard to bring all of it together into a full 360-degree view of your business. This is exactly what Slingshot can do for you – it’s a tool that aggregates data analytics, project and information management, chat, and goals-based strategy benchmarking – all in one, intuitive app. Thanks to the full business intelligence engine inside it, you can quickly connect to your different data sources and create dashboards within minutes.
Creating different types of dashboards and visualizations of data is easier than ever with Slingshot – it can happen with just a few clicks, with many options to edit, a huge load of chart types, filters, and options to save and share your dashboards with internal and external team members.
Drop us a line if you want a demo or have any questions.
Originally from The Ultimate Guide to Data Visualization: Time to Get Good and written by Tsvetomira Petrova.


